Friday, 6 June 2014

Data visualisation workshop with Andy Kirk

This blog post was written on the train on the way home from attending a Data Visualisation course by Andy Kirk : 

So today i had the pleasure of finally meeting Andy Kirk in person by attending his data visualisation course in the big city of London. Now i have stalked Andy for sometime on twitter and been enthralled with his tweets on travel and other equally exiting topics. Occasionally he posts about some tweets about data viz. It seems he is somewhat of an expert in this field, he's  written a couple of books and everything. So I decided to pop down and see what his lessons were like. Despite arriving late due to missing my train by a fraction of a second, seriously I was pressing the open door button but nothing, the course started well with an introduction to the topic. 

Its always a tense time at one of these things when you are being shown bad data viz when you hope and pray that one of yours is going to pop up. Well luckily none of mine were featured in the rogues gallery. Andy had a some real choice examples of just bad bad bad stuff, including the worst pie chart i think i could ever imagine. 

The course went though the thought process of designing a good data viz, it was software agnostic so covered the broader topics of what to and not to include. Andy spent a good amount of time explaining the common data visualisations, bars, scatter plots etc and when and were they should be used. 

There's a strand of the data viz world that argues that everything could be a bar chart. That's possibly true but also possibly
a world without joy.
Amanda Cox, New York Times


There is a lot of voices in the dataviz community that hate chart junk and can be quite dogmatic about it. And yes in a purist sense its fair to say that a lot of the time a simple bar chart would convey the data in a more straightforward way. But, as the quotes andy used said, thats quite boring. It really depends on the situation where the viz is going to be viewed and what the purpose is. If the viz is being viewed as part of a dashboard then a minimal colour scheme and bars or bullets is probably the best choice, you want to see at  glance if there are any issues that need looking into. In that case you have a captive audience that are looking at the dashboard as part of a routine task. On the other hand, if the viz is part of a webpage, or news paper, you only have  a second or two to catch the eye of the reader. You need to engage with them quickly, grab the attention and hook them in. Now in that situation a set of bars all the same colour might not do it, maybe a different viz style would be best. The take home message was, it really depends.
There is no magic bullet for these things, in each case its a judgement call on each situation. Often the most critical people are not the target audience. The Twighlight films might not go down well with 50 something male film critics, but as far as the teenage audience is concerned they love em. The film is made for the audience, not the critic, and so should your viz. So what if it breaks a few rules and gets the purists up in arms, if the audience engage with it, understand it and get the message that you were trying to put across then its worked. 

That same question then leads you to decide wether your data viz is going to be exploratory or explanatory. Are you going to give your audience a data set with a collection of filters and interactions and let them loose to see what insight they can find? Do you want them to read the viz? If the purpose is to explain something then do you need more text, more tool tips. Are you trying to elicit an emotional response from the audience? Which ever of those choices you make then influences the direction in which your viz will take. 

"It’s a common mistake to think that charts are just a fancy way of showing numbers. They’re not. They’re tools for understanding."
Robert Kosara , eagereyes.org

This message really hit home with me and made me think about how i have created vizzes in the past. Am i just creating a bar chart for the sake of it because i think i have to create one rather than show the numbers in a table? Does the bar add anything to the understanding. I'd like to think that i do aid the understanding but it will certainly be something that i will consider in the future. 


I thoroughly enjoyed the course, probably one of the best i have ever attended really. It felt good to know that what i have been doing so far is "correct" and that i hadn't fallen into some of the bad habits Andy talked about. However, its gonna take a long time to get the image of this out of my mind. 


Thursday, 15 May 2014

How to Create A Dual Axis Gantt Chart

I got asked recently if I could help with some data in a gantt chart. Gantt charts are a great way to visual the timeline of a project allowing you to see the duration of separate tasks within a project. The problem they were having was this :


I’ve thrown together a Gantt chart and I want to add a “peak” portion in the middle of each bar.  So each bar represents a project…  let’s say for example Project A lasts from 4/1/14 through 4/15/14.  Well I want that bar to be a light color, aside from the “peak” portion that’s a shade darker… let’s say 4/7/14 through 4/9/14.  So each bar would show the entire time that the project is “active” but it will also show where a team member is busiest with that project.  
This is what the original looked like 


The data included the project start and end dates along with a peak start and end date. These dates were used to create two calculated fields for Project Duration and Peak Duration.

My initial thought was could you create a dual axis gantt chart and overlay the peak durations over the top of the project durations already on the chart. 

First right drag the Peak begin date to the column shelf and select the continuous day. 
Next select dual axis and then synchronise the axis so that the two sets of marks overlap each other. 

At the moment the peak gantt chart is using the project duration as the length of the bars so drag the peak duration measure onto the size shelf of the Peak Begin chart. 


Finally change the transparency of the colours of the project gantt so that they are a lighter shade 


And now your chart should look something like this


So now you are able to clearly see the duration of each of the projects and when the peak activity occurred within each one. I've already come up with a couple of uses for this in my day job, hopefully this little tutorial will be of use to you too. 


Wednesday, 19 March 2014

Make A Splash With Your Dash


How do i let people know how to interact with my dashboard?

I've written before here about the problem of letting people know how to interact with your dashboard and how to display instructions and help on navigating. The problem as i see it is that you have a limited amount of screen real estate and using a large chunk of that up with an explanation that once read doesn't need to read again is a waste. There is the trick of having an "Click here for help" button located somewhere but again this can take up space or can mess up the design of your dashboard. I've come up with a couple of possible solutions, one of which i am going to show you today. It combines dashboard actions, a screen grab and a little trickery to produce a splash screen that will overlay your dashboard that you can use for instructions and then click it away and show the dashboard underneath. 

Its entirely possible to do this using just Tableau, MS Paint and Windows Print Screen command so everyone can do it. 


Step 1: Create your dashboard

So assuming you have got your dashboard that you want to use ready, make sure you set the dashboard size to exactly, in this example i am using the laptop size of 800x600. This is important as we need to make sure that the dash and a splash page are the same size. 

Step 2: Get a screen grab

Now, Tableau does allow you to export and image which would be the easiest thing to do, however, this doesn't work quite how we want it to. If you have filters or parameters in the dashboard when you export them they don't stay looking like buttons, but instead change to standard text as show below. 


So, to get around this we need to take a screen grab. There are lots of screen capture programs out there, the one that I favour is the Snipping Tool that comes with Windows 7. You can also use the Windows print screen command to capture the entire screen and then cut it. Whatever tool you use its important to get all of the dashboard in the capture. 

For this example i will use the print screen command in windows. 

Get the Tableau dashboard on screen and hit SHIFT-PRT SCR

Now, nothing will appear to happen but Windows has just copied the entire screen to the clip board. 


Open MS Paint

Again you can use any paint program that you have. Open MS Paint and hit CRTL-V to paste the clipboard into the program. You will then get the entire screen contents as an image. If you use a dual monitor then you will get both screens so the bit you want might be on the other half. 
We now need to crop the image to just show us the dashboard. 
Use the select tool to put a rectangle around the dashboard.
At the bottom of the screen it tells you the size of the selection so you can make sure that your crop matches the size of the dashboard, in this case its 800x600

Once you have the selection select crop and you know have your dashboard image. Save this can call it splash. 

Put the splash image into Tableau

In order to use this splash image we need to use it as a background image.
Open up your workbook and create two calculated fields, called X and Y, each with the value 1
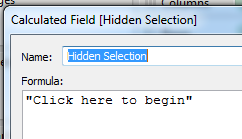
 We also need to create another calculated field to act as a button to switch to the real dashboard. 
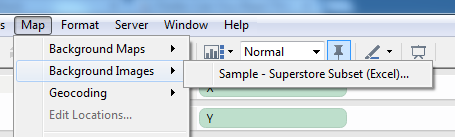
OK, we've got all the pieces we need, now to put it all together. First lets get the background image in place. Go to Maps -> Background Images -> Your data source

In the next window we select the splash image that we captured earlier, we then select the X and Y field and set the right value to 2. 


Then click on options and tick both the boxes for Always show image and lock aspect ratio.
Click OK and go back to the main screen.
Now we drag the X and Y calculated fields onto the column and row shelf, go to Analysis and untick Aggregate measures and the background image appears.

Add some text explanations

Right click on the axis and untick the headers. In the centre of the pane is a mark, which at the moment is a circle. Drag our "Hidden Dimension" to the Label shelf, change the mark type to text and our "Click to begin" text appears in the centre of the image. Change the size to suit and we have something like this

Now, what we do next is entirely up to you. For this example i used point and area annotations to "draw" on the worksheet, but you could use a paint program to draw on the captured image that you are using as the background image. One last thing to do is select Worksheet->Tool tips and clear the text so that the tool tip doesn't appear.

Put it all together

Create a new dashboard, call it splash, set the size to the same as the main dashboard, in this case 800x600 and add the new sheet we just created to it. Set the dashboard to show the entire view and test that its lined up OK by flicking between the two dashboards. Ideally it shouldn't move at all but a couple of pixels is fine. 

Now for the action, click Dashboard->Actions and add a new filter action. The source should be the splash dashboard and the destination the main dashboard.
You then set the action to work on the Select, untick the sheets and set the target filters to be the selected fields and leave it blank like the image. 

Test it

Go to the Splash dash board and click on the "Click to begin Text" and it should flip to the dashboard, and the effect is that the overlay just vanishes. Cool eh. 
The last step is to publish the workbook, but make sure that you select the show tabs option so that the flip works, otherwise it opens in a new window and ruins the effect. 

Here's one i prepared earlier


Wednesday, 5 March 2014

Pick your colour palette carefully

This is a quick post was inspired by Emily Kund and her Vikki Vonn makeovers here, about why using the right colour palette matters and how its easy to miss the real story in the data.

Take a look at this chart that was recently featured in the Guardian. Its looking at the change of average house prices in the UK, split by region.


It shows that prior to the credit crunch house prices across the UK were steadily increasing, then in 2009 all the prices dipped and are now recovering. However there is one major flaw in this chart. The use of a 6 colour palette when there are actually 13 dimensions. This has the effect that the colours are used twice, and in one case 3 times. So you have London, East Mids and N Ireland all using the red line. So its no impossible to pick out which is which. The chart software they have used doesn't allow you to select the region name in the legend and then highlight the relevant line. This becomes a problem when the biggest question i wanted to ask was, "Wow, what region had that massive spike and why is that region declined where every other one has increased." I cannot answer that question at all.

So if we download the data and drop it into Tableau we can produce this, using the same colour palette


Already this is an improvement as we can select the region name from the legend and it highlights the name in the chart, and now we can see that its N Ireland that had that large spike and then the rapid decline. Thats the real story in the data, the exception.

We can go one further by changing the palette to the Tableau 20 put some information in the tool tip and now we get a chart that lets us actually find the story in the data.


 Another option in this case would be to colour ever line the same except for N Ireland as that is where the real interest lies. All the other lines follow the same trend, its the outlier that we really want to look at


Hopefully this shows why its important to be careful when you select your colours. You are potentially missing out on showing the most interesting part of the story, and after all , that's the whole point of the viz in the first place. 

Monday, 10 February 2014

How a Rubber Duck can improve your Tableau Viz


Now I know what you are thinking. He's gone mad!! What on earth does a bright yellow aquatic bird made of rubber possibly got to do with Tableau and how is that supposed to improve my viz? Well just bare with me and it will all become clear.

I've been rubber ducking at work for sometime now, in an open plan office so its not as dodgy as it might sound. Its a process that has been common in software engineering and I have started using it with my Tableau work and its been a great success. So how does it work with coding?

OK, tell me about the Rubber Duck

Well, imagine you are writing a piece of code to extract some data from a database, perform some action on it and display the results to a screen. You've written the code how you think it should work but when you come to run it you get errors, or not the result you expected. You've been working on this code for the last week so know it inside out, but because of the familiarity of it you cannot see what the bug is. I have a buddy in the office that i turn to in situations like this. I get him to sit down with me and i talk through the code, explaining what its supposed to be doing, why I used this approach rather than that. And without fail, just but explaining it out  loud I discover the bug, correct it and now the script works perfectly.

And the Rubber duck?

Simple, sometimes there's no-one in the office or you are working from home, or maybe you always code by yourself. The story goes that a software engineer started explaining how his code worked line by line to a rubber duck that happened to be on his desk and the Rubber Duck debugging method was born. 

Its the simple process of talking through the code that does the trick. I know the code inside and out and know what its supposed to do. By having to actually explain what its doing forces you to actually read the code you have written and observe what it does do.  My buddy didn't do anything other than listen, they don't have to know how to code or what i am trying to do, they just have to listen and let my brain do its thing. 


How does this apply to Tableau?

Designing and building a good viz takes some time. You spend a long time looking at the data and working out how best to display it. By the time it comes to publish the viz you know it inside and out and you know exactly the story that you are trying to convey. You know why you have used each of the filters and how you expect the user to interact with it. And therein lies the problem. You know all this, and assuming that the person that is looking at your viz for the time will also know this just isnt always going to be the case. You get to the point where you can no longer look at the viz objectively, you cannot unlearn how its supposed to work. This is where the rubber duck technique can really help you out. Sitting down with someone and explaining to them the logic behind your viz will show up whether you have conveyed the story that you want to. Showing them how each filter works will highlight those that are really not needed or those that make no sense. Talking through how the viz is supposed to work and seeing what it actually does makes it apparent where the issues are. 

If you work with other people in an office ask someone to sit with you while you go through your dashboard. State what its supposed to show, how the filters let you change the view and how that helps find the story in the data. If you work alone then there are many people in the Tableau community that you can ask to look over your viz for you. A fresh pair of eyes will soon spot glaring problems and if you give them a brief outline of what the viz is supposed to convey, then they can tell you if you are on track.


And if not, get yourself a little rubber duck, sit it on your desk and explain to it what your viz is supposed to work. If you struggle to explain your design then the duck has done its job. 

And as ever, finish with a song, take it away Ernie...


Tuesday, 4 February 2014

Boost your Viz performance with Extracts

Why Extracts are great, and why you should use them

   So I am going to lay my stall out early, i love extracts. I use them as much as possible. At work all of the workbooks i create and publish to our Tableau server use extracts. Well that's not entirely true, out of 127 views, I think 6 might look at a live data table. So, you might be asking, why does he do that? Well first, lets look at what data extracts are.

What is a data extract?


   A Tableau data extract, lets call them TDE is a cache of data stored locally to your tableau instance (desktop or server) that is optimised for fast queries by Tableau. It tends to be a sub-set of data that also allows you to query the data offline. In fact if you publish anything to Tableau Public, you have already made an TDE. 

OK I get that but why use them?

   Speed. Whenever Tableau updates a view or dashboard it has to go and query some data somewhere, apply some filters possibly and then bring back those results and display then for you in whatever style you have chosen. If your data source is a nicely structured datawarehouse running on some nice fancy platform like Terradata or Vertcia then you should get sub second responses and the views update pretty quickly. However sometimes you don't have that, maybe your data connection is slow and its feels a little sluggish to respond. Or, in the case with much of what i do, you are connecting to a database that is used as a transactional one, not designed for easy reporting. You connect to this using some custom sql that may take minutes to bring back the data. Clearly you don't want to wait a minute every time you change a filter.
 
Nothing looks worse to the end user than a sluggish interactive experience. You could have the best looking dashboard, clever Jedi calculated fields, carefully chosen colours and all the charts follow best practise. But, none of that matters to the viewer if when they try to interact nothing seems to happen for seconds. That will be the only thing they notice and remember.

Using an TDE ensures that the data source that Tableau is using is going to provide the fastest user experience possible, which after all what we really want to happen.

But you are looking at stale data, isn't that an issue?

   Not in my experience no. The number of times where someone really really needs to look at totally live data is in fact very small. Mostly people are looking for trends over the last month or year, so the fact that the latest data might be a few hours old isn't going to change the results. If the underlying data isn't changing that often, say twice a day, then you only need to refresh your data twice a day to keep up with it. 

An extract can be set up to be refreshed according to a schedule that you can set, eg daily, hourly, weekly, every 15 minutes. The period that you decide on depends on a couple of factors 
  • How often is new data arriving to your data source that the extract is built on? If its hourly then the extract should be done every 2 hours to ensure it gets the updated data. There is no point having extracts just refreshing when there is no new data. If your warehouse gets built overnight, then refresh once a day, when you know that the warehouse build is complete. 
  • Some extracts can take a long time to build, so you need to make sure that the time between extracts is not so short that it cannot update in time. 
So how do we make an extract?

  • First connect to your datasource 
  • Right click on the name of the datasource and select Extract Data

  • From the next dialogue we can extract just a subset of data based on a filter, aggregate values or only get a number of rows. For our purposes we want everything so click extract

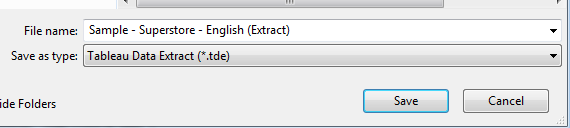
  • We now give the extract a name and save it in our Datasource folder.

  • Tableau now connects to the datasource, grabs all the data and packages up into a TDE for us and saves it to disk. 
  • Now if we look at the data connection we see that the icon has changed to denote we are using an extract. 

  • Now, when we publish the workbook it Tableau will also upload the extract along side the workbook and that will be used for the queries. 
  • Before we upload we need to tell Tableau Server how often to refresh so click on Scheduling & Authentication 

  • Change the  authentication to embedded password if you are connecting to a database.

  • Select your refresh rate and click ok and then publish.

  • You now have a workbook linked to the TDE on Tableau server .
Here's two Jedi tips to make it even better.

Show what database you are connected to and how old the data is

As we are now using an extract its good to tell people how old the data is in the dashboard they are using so if we set the title of our worksheet, not the dashboard title to this.

Now when we view the worksheet we see this in the title

We can now see what datasource we are connected to and when it was last updated. This also works for live connections and i would encourage you to use it everywhere. 

Publish your extract to minimise server overheads. 

If you have two workbooks, lets call them A and B and the both connect to the same TDE and we publish them both then we have two copies of the TDE, say TDE1 and TDE2 on the server which both need to be refreshed ie

A-->TDE1             B-->TDE2

This is a waste of resources and also makes updating dashboards hard as if we want to modify the TDE we have to do it for both copies.

Instead we can publish the TDE to the server and then connect to it like it was any other data source. So that we then have one TDE to refresh and maintain.  ie

A--> TDE <--b class="goog-spellcheck-word" data-="" span="" style="background-color: yellow; background-position: initial initial; background-repeat: initial initial;">blogger
-escaped-div="">
           
  • To do this right click on the extract you want to publish and we get this dialog

  • Select the refresh period we want to use and the authentication to Embed Password and click publish
  • Now when we connect to a new datasource and select Tableau Server we see it in the list of available sources. 
  • Note the icon now changes to a little Tableau logo to tell us we are using an Extract on the Tableau Server. 


Now anyone accessing server can use the same extract, that will refresh its self, be the fastest connection to the data and is easily maintainable. 

Heres a little reminder of when you should use a TDE as opposed to connection live to the date

ScenarioConnect LiveUse Extract
Need up to the second reportingX
Data Is updated hourly, daily etcX
Data source is slow, takes seconds to updateX
Using a fast data warehouseX
Don't need instant updatesX

Hopefully this blog post has shown you why you should use extracts as much as possible with you own Tableau dashboards. Extracts are a great way to optimise the end user experience, which is a vital part of our work. A sluggish dashboard isn't going to make you look good, a snappy fast one will. Extracts allow you to gets around the problem of a slow datasource or a less than optimised database. Publishing extracts to Tableau server makes sharing a curated dataset amongst your users really easy. So you know what everyone is looking at the same few datasources so you know the data is consistent across the sites dashboards.

Wednesday, 29 January 2014

Ten Tips and Tricks for New Tableau users

I while ago, actually over a year now, i was asked to give a little presentation to a group of new Tableau users. I decided to give a talk outlining 10 tips and tricks that would help them in their work. I happened to stumble across the prezi and though it would be worth sharing as the tips are still relevant today. Although aimed at the new Tableau user they are still useful to the seasoned pro.

Saturday, 18 January 2014

Is Tableau Elitist

Is Tableau Elitist?

A few days ago someone going by the name of Mr Elite, who gets a least a couple of points for an ironic name) posted a comment to a blog post on the Tableau Website. The post was "advertising" a viz design competition along the lines of the Iron Viz Championship that has now become established as one of the highlights of the Tableau customer conference. There have been a few of these competitions that have been run outside of Tableau, in particular one at Facebook and one organised by Emily Kund at her workplace. Mr Elites objection appears to be that by Tableau promoting these events it means that only those of Jedi status or greater need apply and that unless you are able to hack your way through advanced table calculations and the like then you are of no interest.

Now when i read that comment I smelt the faint whiff of troll, not in small part to the fact it was an anonymous comment which always seems to have a certain fragrance, there seems to be a lot of hostility in the language. My initial reaction was they they were talking a load of rubbish and after reflecting on it for a few days I haven't changed my mind.

A year or so ago Stephen Few wrote a blog post about the fact that Tableau had lost its way by including viz types that fall outside the accepted best practices types, word clouds, bubble charts and the like. In it he argued that the thing that made Tableau so good was that it guided you down the accepted path. This started a big, and rather heated debate with people pointing out cases when these non-standard chart types can be valid and reasons why sometimes you need you viz to have a little bit more bling to catch the eye. Mr Elites comments, though no where near the quality or reasonably argued as Stephens did make me think back to how the product and the user base has changed.

Tableau is now at version 8.1, its had many years of refinement and development. There have been numerous new features added, some major, some minor, some game changing, others not so much. There are some glaring omissions (would it kill them to put frigging autosave in? Its kinda standard thing now and you just assume its there in the background, just in case you need it Vote for it here). The software has matured, and therefore so has the userbase. You have people that have been using it since the very first version, many have been using it for years and so naturally their skills have improved. They know all the little tricks to get every ounce of the program and make it do things that no-one knew it could do. There are people whos design skills create beautiful dashboards that look a million miles away from the standard bar chart. But each and everyone of those people at one point was a newbie. They all sat down with a blank page and wondered what these buttons did. What a pill was, and why was it blue and green. Why this function didnt work how they thought it would and swore at the screen.

A superb blog post by Emily Kund (One of the best tableau blog posts of the last 12 months) talked about her own Identity Crisis in the Tableau world as she had reached a cross roads and was unsure where to go in order to improve her Tableau skills. This generated a fascinating debate about peoples skills and specialist areas within Tableau. One of the things its really highlighted though, and here's what Mr Elite should note, theres not a single person working with Tableau that knows everything. Some people are fantastic at advanced Table Calculations, Some hack the xml, some concentrate on design, others on performance. Even those in the Zen Masters, those most revered in the community are not experts at everything, but what they do all share is the willingness to help others.

i think Tableau is the most intuitive and easy to use pieces of software that i have come across. Every time i click a button or move a slider or select an option you can sense the fact that someone thought about how that action should behave. A novice, wil very little instruction can go from zero to a fully interactive dashboard in a matter of hours, just by feeling thier way around the interface and experimenting. And if they need help, well its everywhere. Tableau themselves provide a superb manual and hours of instructional videos, all for free. You can download any public dashboard, pick it apart and see how it was made (this is a superb learning tool). There is the forum, Facebook, twitter where the community hangout, ready and willing to help anyone, at any level with any problem, no matter how big or how small. You never feel dumb for asking the most simple question, why? cos everyone had that same question once.

Far from being a tool for the Elite, Tableau feels like the tool for everyone. Elissa Fink said in a recent interview that they want to put data discovery into the hands or the normal user, and not the preserve of the data scientist or analysis. I've seen that first hand at our work where people are able to interrogate their own data and get real insight, without every knowing anything about data structures, SQL, warehousing. What they do know is what the dimensions mean and what the significance of a 0.5% increase in a measure this month is to their department.

Going back to the Viz contests that are cropping up and whos existence sparked the Mr Elite comments. Instead of seeing this as elitist and only rewarding those that know how to hack the software or are at Yoda levels of competence they should be seen as a learning opportunity. Give the same data set, what do difference people come up with. What techniques do they use, how do they get around those little problems that still hold Tableau back. They serve to show you whats possible to achieve and that anyone can also produce work to that standard.

See them as what you can do, not what you have to do.

Thursday, 12 September 2013

Touch me, play with me.....

So i am sitting in the airport waiting for my flight and i am thinking back over my time at TCC13. To be fair a lot of it is a blur as a combination of so much content, full on networking, fire alarms, hanging with Chuck Hooper (THE Chuckfather) seems to have muddled my brain somewhat. It was great to meet so many of the Tableau family that i have known from the interwebs for some time and finally put a voice to the avatar.

One thing that sticks in my mind came from the very first day, it was a topic that came up in 4 separate talks and i think its the next big hurdle that we face. How do you get your consumer of your dashboards and vizii to interact with them.

The first hurdle that Tableau faced, and any dataviz maker for that matter was getting past the "But i want it in Excel" mentality. Well i think that particular battle as been won, or at the very least victory is around the corner. The average person is now used to data visualisations, they are everywhere now, some good, a lot bad. Infographics are the new cool way of spreading information in an eye catching way. People are comfortable with trusting the pictures rather than seeing the numbers behind them.

We are in an isolated bubble. We that create the dashboards, attend TCC, know and love interactive dashboards. We spend hours crafting them, adding parameters, creating actions that allow data discovery that their own pace. We know that, but our consumers often don't realise that these dashboards can be played with. Often all that time we spend making our work dynamic and interactive never actually gets used. Its like buying a Ferrari and just driving to the shops and back. Sure it works as intended but there is so much more power that is just being under used. I suspect that i am not the only one that hovers over every chart they see on a webpage, expecting and not always getting a pop up or dynamic action.

From my own work i have experienced this. i have created dashboards with cool actions, clever parameters that let you change the entire look of the workbook, but when i have happened to go to see people they haven't realised they could do that. Maybe we have a greater level of curiosity than our consumers, or maybe we need to put a little more into our work to make it irresistible for them not to play. I wonder how much of my time has been wasted adding features that were not needed. Now maybe thats my fault and i should just produce what's required, but I want to make the very best dashboards i can, so if i spend the time i want to make sure people make the most of it.

So what's the solution? i don't know, but i suspect its not a single solution, but here's a few thoughts.

  • Time - Most peoples exposure to charts have been in the printed media, or on a projector in a meeting rather than on their browser. As time goes on and they see more of it on their desktops it will seem normal to be able to interact. 
  • New Tech - Kelly Martin (@VizCandy) suggested giving everyone iPads, the tactile nature of touch screens just invites you to touch the screen. For some its now second nature, my 2 year old will stroke my laptop screen expecting things to move about.  
  • Tell them - A simple solution is to put instructions somewhere on the dashboard, let them know where to click, how to interact. 
  • Trick them - I've never used hover action filters but this seems like a great use of them. Having a select action in order to interactive requires active participation. Having it as hover you are more likely to accidentally discover that "It moves"
Depending on the dashboard, the consumer and the actions in the dashboard some of these might not be possible, or practical. Assuming that our audience knows how to interact with our work, might be wasting some of our valuable time. Maybe we need to spend a little more and teach them how to the a curious 2 year old, and remember how to play.

Safe Travels everyone.

Thursday, 13 June 2013

Create a default Tableau Template - now with added 8.1 goodness

One of the things missing from Tableau are workbook themes or stylesheets. Although themes are listed there are only two and you cannot customise and save them to you liking. At #tcceu13 i asked Jock Mackinlay about this and he said he has a team of people looking into it.

Do you spend a long time getting a dashboard looking just right, maybe you have a company colour scheme that you have to adhere to.

Each time you have to create a new colour palate.

Tired of having to format your dashboard again and again each time?

Well good news, heres a way that you can create your template that you can create once and then re-use when ever you need to.
  1. Create a new workbook with one sheet and one dashboard. Name them sheet Default Sheet and Default Dashboard.
  2. If you always use the same datasource then connect to it, but if not just leave that blank.
  3. Change the formatting of your sheet and dashboard to your liking. 
  4. Set the default size of the dashboard , the background colours, the font sizing and colour any default titles you like, background images. Everything that you normally have to do again and again. 
  5. If you want to set up some custom palettes for the colour shelf then follow the instructions here http://wannabedatarockstar.blogspot.co.uk/2013/04/colour-me-right.html
  6. Now save your workbook to something like Tableau_template. If you are going to make several different ones then name them something sensible. 
  7. Here's the really important crucial bit. Find the workbook you have created and right click, select properties and set it to read only. This is the magic bit. 

Next time you have to make a dashboard, simply load up the Template dashboard, connect to your data. Make sure that you make a copy of the sheet and dashboard, don't use the create new button or you will not have the formatting set. By copying the defaults it means you can have multiple sheets and dashboards. Then create the viz and as you build it all of the formatting that you just set-up will be in place. By making the workbook read only you are prompted to save it with a different name, which means you can use the same template again and again. 

Hopefully in the near future this will be part of Tableau, but in the meantime this works really nicely.

Need more info? then tweet me @Matt_Francis

Post Tableau 8.1 Update

One of the things that Tableau lacks, even with shiny new 8.1 is Templates. I wrote a previous post about a method for creating a template sheet and dashboard, saving the workbook as a read only file and then using that as a starting point for all your work.

However this relies on you remembering to open that template workbook in the first place. Now with 8.1 you can copy and past both sheets, but now dashboards between open workbooks.

So now we can use this with out templates in the following way. 

1. Create a workbook with loads of sheets and dashboards, all formated in ways that you like to use eg, light pallete, dark pallete etc,2x2 layout 2x3 layout etc

2. Save this and set it read-only just in case.

3. Now next time you create a viz and when you am ready to create a dashboard from it, you load up the template workbook, select the dashboard layout you want to use, and copy and paste it into the new workbook. The carries all the formatting over so all you have to do it add in the sheets and publish! No mess, no fuss.


Thursday, 25 April 2013

Colour me right

So here's the scene.

You've spent some time getting the data into a sensible format, connected it to it with Tableau and created beautiful dashboard. It's got parameters, filters, actions and works brilliantly. You've used all the correct analytical techniques and only used the approved chart types and followed best practice. The three sheets tell the story of the data and provide real insight into the underlying detail within. So you publish it and send it to the customer for review/feedback.

Time passes, you read a book, get a coffee, and then the feedback arrives. It's really great but can we change the colours of the bars to match the corporate scheme? Yes, for some reason they don't want to use the a palette in Tableau; they want to have it fuchsia, orchid and a shade of green that might best be described as moss. You explain that the colour palettes in Tableau  were chosen as they work well together, lots of time and money went into finding that out. They think that's great, but they still want their corporate colours. So what do you do?

Well it's actually pretty simple to customize Tableau so that it will fit with any existing scheme. You need to get a few bits of information and know where to put them. So first let's get the colours.

Now the way you select colours on a computer can vary depending on the program you are using. Typically this is either the RGB values or the Hex values.

RGB values are a set of 3 numbers from 0 to 255

0,0,0 is black
255,255,255 is white
255,0,0,0 is pure red
0,255,0 is pure green
0,0,255 is pure blue.

So combinations of these numbers make every colour available.

Hex values work in a similar way but are written in a single string eg

#000000 is black
#ffffff is white
#ff0000 is red
#00ff00 is green
#0000ff is blue

If you already know the RGB or hex values of you required colours then you can skip ahead a bit......

Ok if you are still here then I will assume that all you have is the company logo.
Load up the logo image into Paint and select the colour picker tool (it looks like a medicine dropper) and pick up one of the colours from the logo. This is now selected as colour 1. Now click on the edit colours and this brings up the colour editor dialogue with out selected colour already highlighted. On the right hand side are the RGB values for our selected colour. Make a note of these 3 values and repeat for all the colours that you want to use.

So for example
247 53 232
108 72 183
24 149 6

Now, Tableau uses the hex values for its palette so we need to convert our RGB values into hex. This is a good website for doing just that :

http://www.colorpicker.com/

Just enter your RGB values and it displays the corresponding hex value, make a note of these for your scheme

#F735E8
#6C48B7
#189506

We've now got our colours in the correct format so we can now enter them into Tableau.
If you go into your "My Tableau Repository" directory (which on my machine is in the My Documents folder) you will find a file called Preferences.tps. Right click and open it up in notepad (or whatever text editor you want to use), this is where we will add our colour scheme.

You need to add the following bit of code to the file within the <preferences></preferences> lines (and here’s a tip, copy and paste the code that is currently in the preferences file and modify it for the name of the palette and the hex values, in the order you would like them displayed) :


<color-palette name="Our Company Colours" type="regular">
      <color>#F735E8</color>
      <color>#6C48B7</color>
      <color>#189506</color>
</color-palette>


The name of the palette is what will appear in Tableau so make it something that makes sense to you. In-between the <color></color> you put your own hex values that you found earlier. Save this file and launch Tableau.
Now when we drag our dimension onto the colour shelf, click edit colours and select the palette we see :


Select your new palette, click assign palette, OK and the new company colour are now in the viz.

This palette will always be available to you, providing you don't change the preference file. If you want another new palette just copy and paste the code you used before but change the name. If you then publish this to server and someone else downloads and edits it, then they will also need to have the settings in their preference file as well. The palette is linked to your desktop install, not the workbook.

The community forum on tableausoftware.com is an excellent resource for more information on color palettes. Thanks to Michael Cristiani for this reference http://community.tableausoftware.com/thread/117530 on using Color Brewer’s palettes in Tableau.  Twitter, user groups,  and the Tableau community forum are all great resources to get help.

You can check to see if your custom palette will be good for those with color blindness by checking it here http://www.vischeck.com/

So you know you know how to bend or break the colour rules, go forth and create beautiful dashboards based on sound colour principles or garish monstrosities.


biz.